 US Students

ACT Test Registration Information
Everything you need to know about registering for the ACT.
Register for the ACT | Requirements | Test Dates | Costs | EOS | Special Circumstances
Prep for College This Summer With ACT!
With your June ACT registration, you get:
- $9 off your ACT Test Information Release (TIR) question and answer key*
(Promo code JUNETIR). - Access to a FREE college planning event hosted by Encourage®.
- Exclusive participation in Q&A sessions with ACT’s lineup of college counseling professionals (dates and seats will be limited).
Offers are only good until May 19 at 11:59 p.m. CT, so start planning for college today!
June Promo FAQs
*$9 off promo code for TIR only valid when taking the paper test in June. This code is non-transferable and cannot be used in conjunction with any other offer or redeemed for cash or credit. This code is only applicable for the base exam and TIR. Add-ons and/or additional products or services are not covered, including but not limited to the writing exam, additional test preparation solutions not specified or additional score reports. This code and the purchase of the TIR only applies to those taking the paper test in June.
Upcoming Test Dates (National)
| Test Date |
Regular Registration Deadline Late Fee Applies After This Date |
Late Registration Deadline |
|---|---|---|
| June 8, 2024 | May 3 | May 19 |
| July 13, 2024* | June 7 | June 21 |
View more information on test dates.
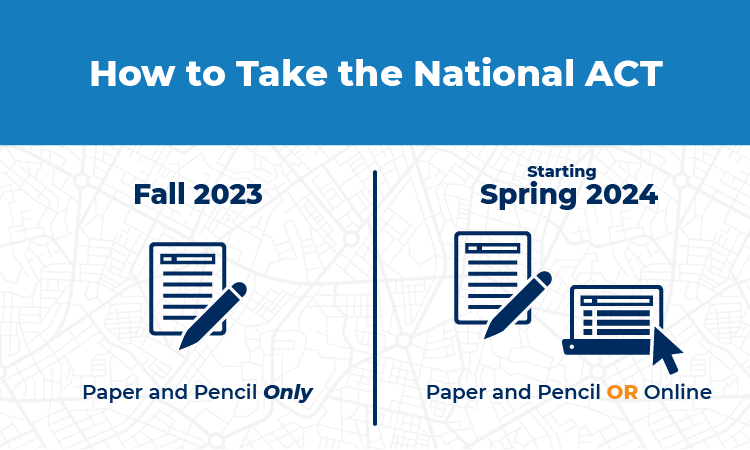
A Fresh, Flexible Way To Take
the ACT!
Starting February 2024, ACT will offer an online testing option at select locations nationwide. Learn more about ACT’s online national test experience.
Test Dates
National test dates are for the United States, US territories, and Puerto Rico.
- If you missed the regular registration deadline for a test date, you can still register by the late registration deadline for an additional fee.
- If you did not register for a test date by the late registration deadline, you may be able to request standby testing for an additional fee.
Deadlines occur at midnight Central Time.
If you are unable to test on a Saturday test date for religious reasons, there may be options available to you. See Non-Saturday Testing.
All requests for Accommodations and English Learner supports, including appeals, must be submitted by the late registration deadline through the Test Accessibility and Accommodations (TAA) system.
2024 Spring and Summer National Test Dates Schedule
| Test Date |
Regular Registration Deadline Late Fee Applies After This Date |
Late Registration Deadline |
Photo Upload and Standby Deadline |
|---|---|---|---|
| April 13, 2024 | March 8 | March 24 | April 5 |
| June 8, 2024 | May 3 | May 19 | May 31 |
| July 13, 2024* | June 7 | June 21 | July 5 |
*No test centers are scheduled in New York for the July test date.
Test Information Release for the 2024 testing year will occur in April and June. See www.act.org/the-act/tir for more information.
2024-2025 National Test Dates Schedule
| Test Date |
Regular Registration Deadline Late Fee Applies After This Date |
Late Registration Deadline |
Photo Upload and Standby Deadline |
|---|---|---|---|
| September 14, 2024 | August 9 | August 25 | September 6 |
| October 26, 2024 | September 20 | October 7 | October 18 |
| December 14, 2024 | November 8 | November 22 | December 6 |
| February 8, 2025 | January 3 | January 20 | January 31 |
| April 5, 2025 | February 28 | March 16 | March 28 |
| June 14, 2025 | May 9 | May 26 | June 6 |
| July 12, 2025* | June 6 | June 20 | July 4 |
*No test centers are scheduled in New York for the July test date.
Test Information Release for the 2024-2025 testing year will occur in September, December, and February. See www.act.org/the-act/tir for more information.
Additional Information for Registration
Saying “Yes” to EOS
Get discovered by colleges. When you register you can opt-in to ACT’s Educational Opportunity Service (EOS). EOS will connect you with colleges, universities, and financial aid institutions based on your plans and interests. Expand your vision for college and open up new ways to pay for it.
Information on opting out of EOS.